In this article we will discuss about the method of field investigation for sporadic diseases seen in animals.
Sporadic diseases occur with low frequency and with no obvious temporal pattern. This definition by no means indicates that a sporadic disease occurs totally at random (i.e., without any pattern), nor does it mean that the disease is of no consequence.
In fact, some of the most interesting animal diseases from an epidemiologic point of view belong to the group of sporadic diseases. These include the majority of diseases of general veterinary interest (e.g., chronic, neoplastic, and degenerative disorders; acute non-contagious problems such as traumatic lesions and poisonings; and genetically related problems).
Many sporadic diseases have an unknown or complex multi-factorial etiology. An especially interesting group of sporadic diseases are those of comparative relevance to human health problems (e.g., cancer, degenerative diseases, and congenital defects) in relation to their possible environmental determinants.
ADVERTISEMENTS:
In addition to increased insight into the causes of disease, epidemiologic studies may help practicing veterinarians recognize animals with a high risk of a particular sporadic disease, and thus improve the likelihood of proper diagnosis, treatment, and prevention.
Availability and Validity of Data:
A major problem of sporadic disease investigations is obtaining sufficiently accurate epidemiologic data about the disease because of its rare and unpredictable occurrence. Most methods used for retrieval of case data are, by the very nature of the problem, retrospective in their approach.
These include surveys of existing records from herds, practices, and laboratories, and the establishment of centralized data banks for such records from one or more institutions to support subsequent retrospective searches for cases of a particular disease. The validity of the information on sporadic diseases is of critical importance.
Special problems in this regard with studies of sporadic diseases are as follows:
ADVERTISEMENTS:
(1) Often several diagnosticians and institutions contribute cases, and there may be no standardized nomenclature or common diagnostic criteria;
(2) Definitions of syndromes, particularly those of unknown etiology, tend to change gradually as new diagnostic methods become available, and this increases the problems with retrospective use of case records;
(3) Only small case series may be available for the study of a rare condition, thus relying heavily on the validity of each recorded event; and
(4) Biased selection of cases. Because such potential biasing factors are very likely to affect the results of an analytic observational study of a sporadic disease, even though appropriate standard analytic design and analysis are being applied, it is particularly important to utilize the judgment criteria in any causal interpretation of results.
ADVERTISEMENTS:
In case-control and cross-sectional studies (i.e., non-prospective designs) special emphasis needs to be placed on ensuring a proper temporal sequence from exposure to disease. For example, using data from the DHIA system, in a case-control study of mycoplasma mastitis among California dairy herds, an association was found between the occurrence of mycoplasma mastitis and increased culling rates for the same year (Table 12.3).
To establish the most likely temporal sequence between these events, culling rates for adjacent years were obtained. Since increased culling coincided with the outbreak, the authors concluded that mastitis was most likely the cause of high culling rates rather than vice versa (in which case high culling rates would have been expected at least for the year preceding the problem).
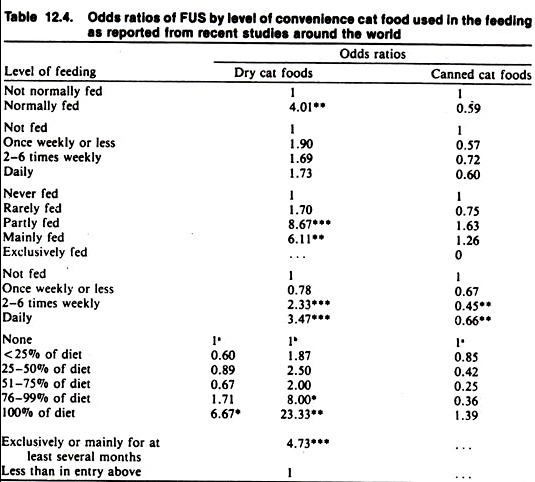
The application of the remaining criteria for causation may be illustrated from the data found in case-control studies on the relationship between dietary factors and the feline urologic syndrome (FUS).
The consistency of findings among different studies in different countries using different scales of characterizing the level of feeding of dry cat foods (DCF) supports causality to be the reason for the observed association between DCF and FUS (Table 12.4).
In addition, causality is strengthened by the observed dose-response relationship as well as coherence with other biologic facts. These examples demonstrate the general benefit from collecting data suitable for establishing a dose-response relationship as the results are much more convincing than merely comparing two levels of a factor (i.e., fed versus not fed, exposed versus not exposed).
Also note that the ordering of exposure may be done when the independent variables are ordinal (qualitative) in type, as well as when they are ratio level (quantitative) variables.
Investigating the reasons for lack of consistency in results among different studies may reveal the nature of any bias affecting a study. For example, other issues in FUS are whether castration increases the risk, whether there is a difference in risk among cat breeds, and whether multiple cat households experience more cases than expected from a common risk.
ADVERTISEMENTS:
Part of the controversy over these issues is due to conflicting evidence between laboratory experiments and epidemiologic studies, and disagreements among published epidemiologic studies. Non-agreement between laboratory experiments and epidemiologic studies of multi-etiologic sporadic diseases such as FUS may have many explanations.
One reason is that multi-factorial diseases, such as FUS, often are not suitable for laboratory experiments where changes in only one or a few putative causal factor(s) are investigated at a time. In other words, laboratory studies may not be a relevant model of the spontaneous field situation and the results may not be applicable to the field.
Furthermore, to produce a specified minimum number of clinical cases in a laboratory environment, either unrealistically large-scale experiments are required, or extreme exposures not typical of field conditions often must be used to reproduce the disease. The latter feature makes it difficult to extrapolate the laboratory results beyond that setting.
Estimating Frequency:
It is difficult to estimate the incidence of a sporadic disease by direct methods. Therefore indirect methods are often applied, some more appropriate than others.
As one example, a retrospective longitudinal study was used to estimate the incidence of the feline urologic syndrome (FUS) in British and U.S. household cat populations. Telephone interviews were conducted with cat owners about episodes of FUS that occurred during the preceding 12-month period.
The resulting incidence rate of approximately 0.6% per year agrees well with estimates based on FUS case loads seen in some veterinary practices in England, where the number of cases was related to the estimated cat population at risk in the practice areas after adjusting for possible non-veterinary- attended cases (Table 12.5).
(As mentioned throughout this text, caution should be taken not to mistake proportional morbidity rates for incidence rates. It is obviously much easier to calculate the former because data on the total number of cases seen in a practice or a laboratory are more easily available than estimates of the population at risk. Confusion has resulted from published figures of 1-10% of all cats seen in veterinary hospitals being FUS cases, because these figures have been incorrectly termed “incidence of FUS.”)
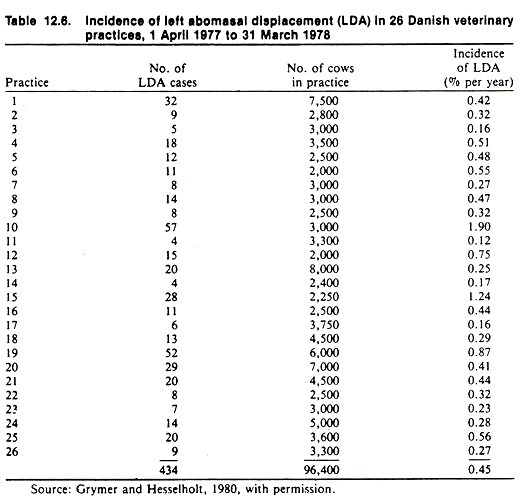
As another example of estimating the frequency of sporadic disease, the incidence of LDA in Danish dairy cattle was estimated from an interview survey of veterinarians who provided the number of LDA cases and the average dairy cattle population in their respective practice area over the previous year (Table 12.6).
Similarly, estimates of the frequency of clinical bovine leukemia in Canada were derived through questioning of selected practitioners as well as routine slaughterhouse data. These data were related to the population at risk to estimate the rate of clinical leukemia.
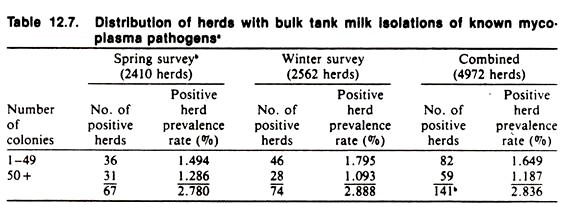
In situations where routine collection of test samples is made for quality control (e.g., antibiotic residues in milk and meat) or as part of a routine monitoring program (e.g., of herd prevalence of mastitis), special surveys for sporadic diseases may be carried out inexpensively. For example, in California two state-wide bulk tank surveys were made in 1977-78 to estimate the prevalence of pathogenic mycoplasma in bulk tank milk among dairy herds (Table 12.7).
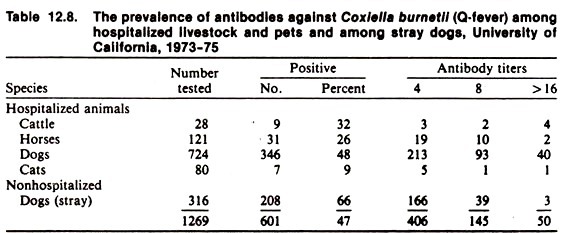
Because many infections remain subclinical, the prevalence of infection is expected to be much more common than the disease; in fact, the presence of a putative pathogen may not be a good predictor of clinical disease. Similarly, surveys of seroreaction to agents associated with sporadic clinical disorders often show that, although the clinical condition may be sporadic, serological evidence of infection is by no means rare or unpredictable (Table 12.8).
For example, clinical disease due to Histoplasma capsulatum in the dog is a serious, infrequent, often unpredictable disease, yet infection of dogs with this organism appears to be widespread and usually of little consequence.
The prevalence of sporadic conditions in populations may be more feasible to estimate as part of ongoing disease monitoring systems (e.g., at a slaughterhouse) or from screening a sample of the population, particularly if the condition is chronic.
For example, the slaughterhouse data given in Table 12.9 are based on a large sample of animals, and assuming complete and accurate reporting (this is a major assumption), the resulting prevalence estimate should be close to the true population prevalence rate (small sampling variance).
This is particularly true if the condition has a low case-fatality rate and does not alter the performance of the animals (i.e., they are not at increased risk of culling or slaughter because they have the disease).
Other studies of the prevalence of sporadic diseases performed on very small samples (e.g., a study to estimate the prevalence of systemic lupus erythematosus (SLE) reactions among dogs belonging to people with SLE to investigate if there is an association between SLE in the two species) will have a large sampling error.
Because of the large sampling variance, a prevalence estimate of zero is not very meaningful. The data in Table 2.1 can be used to derive upper confidence limit (either 95% or 99%) for the prevalence of disease in these situations.
For example, if 1% of a population of 10,000 dogs were randomly selected and none were found to have the disease in question, the anticipated maximum number of cases in that population is 294, giving a 95% upper confidence limit of 2.9%. Despite these calculations, however, one remains rather uncertain of the true prevalence.
Characterizing the Case Series:
Usually, the common characteristics of diseased individuals will be summarized in terms of the age, breed, and sex distribution. However, one must be careful in making inferences about the importance of these demographic factors as determinants of the disease based on the characteristics of diseased animals only.
For example, in a descriptive sense it may be true that most cat patients with FUS are domestic shorthair. This, however, only reflects the fact that most household cats are domestic shorthair and it does not indicate a high risk of FUS for that type of cat.
Similarly, in many case series of canine Cushing’s syndrome, there is a predominance of female over male dogs. However, this does not mean that female dogs are at higher risk than males.
One reason why the female excess attracts attention may be the fact that in human cases of Cushing’s syndrome a true female predominance exists, and thus female excess among a series of canine patients is more likely to be published than a male excess in a canine case series. (This feature has been called a “publication bias.”)


