The following points highlight the top three models of energy flow in a community. The models are: 1. Single Channel Energy Flow Model 2. Y-Shaped/two Channel Energy Flow Model 3. Universal Model.
Model # 1. Single Channel Energy Flow Model:
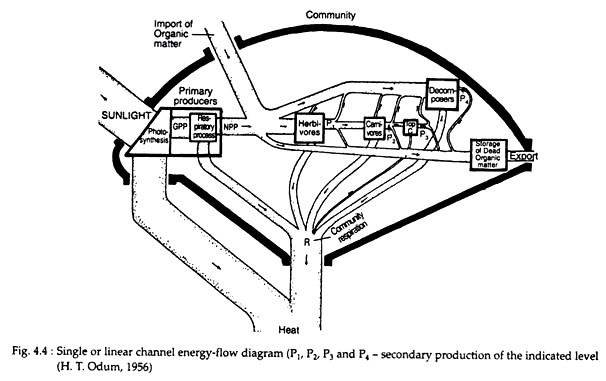
The single or linear channel energy flow model is one of the first published models pioneered by H. T. Odum in 1956. As can be seen in Fig. 4.4, this model depicts a community boundary and, in addition to light and heat flows, it also includes import, export and storage of organic matter.
Decomposer organisms are placed in a separate box as a means of partially separating the grazing and detritus food chains. Decomposers are actually a mixed group in terms of energy levels and their importance in this energy flow model is overlooked. This model will suffice as long as only the imports and exports are considered.
Model # 2. Y-Shaped/two Channel Energy Flow Model:
In this type of model, the grazing and detritus food chains are shown as separate flows (Fig. 4.5).
ADVERTISEMENTS:
This is a more practical working model than the single channel model mainly because:
(1) It relates to the basic stratified structure of ecosystem;
(2) The direct consumption of living plants and dead organic matter are usually separated in both time and space; and
ADVERTISEMENTS:
(3) The macro consumers and micro consumers differ greatly in size-metabolism relations and in the techniques required for studying them.
The grazing and detritus food chains are inter-connected. Moreover, not all food eaten by grazers is actually assimilated, as some (feces containing undigested material) is diverted to the detritus pathway. Also, the amount of net production energy that flows down the two pathways varies in different kinds of ecosystems and, often in the same ecosystem; it may vary seasonally or annually.
The energy flow in case of shallow waters and heavily grazed pastures or grassland shows larger energy flow via the grazing food chain than in the detritus pathway. The reverse is true in case of the forest, marshes and oceans.
ADVERTISEMENTS:
Most natural ecosystems operate as detrital system, where 90 percent or more of the autotrophs’ production is not consumed by heterotrophs until the leaves, stems and other plant parts die and are processed into particulate and dissolved organic matter in water, soil and sediments.
This delayed consumption increases the structural complexity and biodiversity. It also increases the storage and buffering capacities of ecosystems. For example, there would be no forests if all free seedlings were grazed upon.
Model # 3. Universal Model:
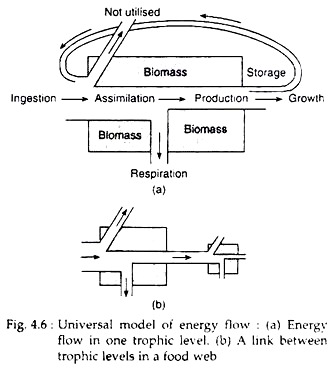
The universal model (Fig. 4.6) is applicable to any living component, which may be plant, animal, microorganism, individual, population or trophic group.
The shaded box (Fig. 4.6) represents the living, standing crop biomass (generally measured as some kind of weight, such as dry weight, wet weight etc.) of the component which should be expressed in calories, so that its relation with rates of energy flow can be established. The total energy input or intake or ingestion varies. For strict autotrophs, it is light, while, for strict heterotrophs, it is organic food.
A key feature of the model is the separation of assimilated energy (A) into the production (P) and respiration (R) components. R is the energy that is lost as heat (maintenance energy) and P is the portion transformed to new or different organic matter and is the part that is available to the next trophic level.
At the same time, the non- assimilated component (NU – not utilised), such as feces, enters the detritus food chain. It is important to note that P component is energy that is available to the next trophic level while NU component is energy that is still available at the same trophic level.
The universal energy flow can be used in two ways:
(1) The model can represent a species population with appropriate energy inputs and its link with other species, and
ADVERTISEMENTS:
(2) The model can represent a discrete energy level, where the biomass and energy channels represent all or part of many populations supported by the same energy source. For example, foxes obtain their food partly by eating plants (fruits) and partly by eating herbivore animals (rabbit, mice etc.).
So a single box diagram can be used to represent the whole population of foxes if intra-population energetics were to be stressed.
On the other hand, two or more boxes (Fig. 4.6b.) would be employed if the fox population is considered in two trophic levels according to the proportion of plant and animal food consumed. In this way, the fox population can be placed into the overall pattern of energy flow in the community.


